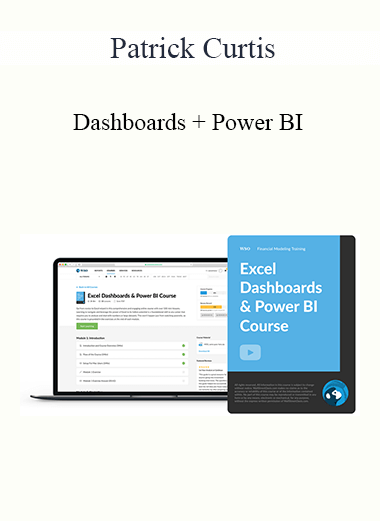
Patrick Curtis – Dashboards + Power BI
Original price was: $97.00.$25.20Current price is: $25.20.
Description
Unlock your potential with the Unlock your potential with the Patrick Curtis - Dashboards + Power BIPatrick Curtis - Dashboards + Power BI course for only course for only Original price was: $97.00.Original price was: $97.00.$$25.2025.20Current price is: $25.20.Current price is: $25.20. at at Giolib.comGiolib.com! Explore our comprehensive library of over 60,000 downloadable digital courses across various ! Explore our comprehensive library of over 60,000 downloadable digital courses across various Business & SalesBusiness & Sales. Get expert-led, self-paced learning at up to 80% savings. Elevate your skills today!. Get expert-led, self-paced learning at up to 80% savings. Elevate your skills today!

In this module, we use In this module, we use 6 video lessons6 video lessons to explain the key components and best practices when creating an Excel dashboard. This includes a to explain the key components and best practices when creating an Excel dashboard. This includes a step-by-step walkthroughstep-by-step walkthrough of a company sales dataset and an explanation of important metrics pertinent to our case study. of a company sales dataset and an explanation of important metrics pertinent to our case study.
In this module, we use In this module, we use 7 video lessons7 video lessons to provide a walkthrough on how to to provide a walkthrough on how to modify our dataset to create several key charts and indicatorsmodify our dataset to create several key charts and indicators in our Excel dashboard. We wrap up this module by exploring Combo Charts, an efficient and dynamic way of comparing data. in our Excel dashboard. We wrap up this module by exploring Combo Charts, an efficient and dynamic way of comparing data.
In this module, we use In this module, we use 8 video lessons8 video lessons to expand upon the charts we created in previous modules by adding Dynamic Charts and Net Promoter Score (among other topics). This module also includes a to expand upon the charts we created in previous modules by adding Dynamic Charts and Net Promoter Score (among other topics). This module also includes a tutorial on how we can use dynamic coding to make our data malleabletutorial on how we can use dynamic coding to make our data malleable and conditional formatting to provide visually appealing dashboards. and conditional formatting to provide visually appealing dashboards.
In this module, we use In this module, we use 2 video lessons2 video lessons to tie together the different charts we have created in previous modules, to tie together the different charts we have created in previous modules, using the dashboard to provide conclusive datausing the dashboard to provide conclusive data that can be presented. We wrap things up by offering several tips to continue improving on your Excel Dashboards. that can be presented. We wrap things up by offering several tips to continue improving on your Excel Dashboards.
In this module, we use In this module, we use 5 video lessons5 video lessons to dive into Power BI, a tool that provides additional customization and filters that are not available in Excel. This includes a brief to dive into Power BI, a tool that provides additional customization and filters that are not available in Excel. This includes a brief overview of Power BI functionality, customizable slicers, and automatable data linking and sortingoverview of Power BI functionality, customizable slicers, and automatable data linking and sorting..
In this module, we use In this module, we use 5 video lessons5 video lessons to explore column charts, pie charts, and bar charts and how to fully use Power BI to to explore column charts, pie charts, and bar charts and how to fully use Power BI to create dynamic visualizationscreate dynamic visualizations. We wrap up this module by learning how to use slicers to control interactions between different charts.. We wrap up this module by learning how to use slicers to control interactions between different charts.
In this module, we use In this module, we use 7 video lessons7 video lessons to dive deeper into more advanced visualizations such as Filled Map Visualizations, Scatter Plots, and Funnel Charts. This module also includes a to dive deeper into more advanced visualizations such as Filled Map Visualizations, Scatter Plots, and Funnel Charts. This module also includes a step-by-step walkthroughstep-by-step walkthrough on how to create these visualizations. on how to create these visualizations.
In this module, we use In this module, we use 2 video lessons2 video lessons to explore the special features of Power BI online such as interconnectivity with clients. We wrap up this module by exploring to explore the special features of Power BI online such as interconnectivity with clients. We wrap up this module by exploring insights and correlationsinsights and correlations that Power BI is able to autonomously generate using your data. that Power BI is able to autonomously generate using your data.
Below you will find a list of the modules and lessons included in this course.Below you will find a list of the modules and lessons included in this course.
Future-proof your knowledge with the Future-proof your knowledge with the Patrick Curtis - Dashboards + Power BIPatrick Curtis - Dashboards + Power BI course at course at GiOlibGiOlib! Enjoy lifetime access to high-quality digital content, crafted to advance your career and personal development.! Enjoy lifetime access to high-quality digital content, crafted to advance your career and personal development.
- Lifetime Access:Lifetime Access: Permanent access to all purchased courses. Permanent access to all purchased courses.
- Smart Savings:Smart Savings: Benefit from prices up to 80% off original course costs. Benefit from prices up to 80% off original course costs.
- Safe Transactions:Safe Transactions: Process your payments securely. Process your payments securely.
- Practical Insights:Practical Insights: Gain actionable skills relevant to today's demands. Gain actionable skills relevant to today's demands.
- Instant Availability:Instant Availability: Begin your course immediately after payment. Begin your course immediately after payment.
- Flexible Learning:Flexible Learning: Access content effortlessly on any device. Access content effortlessly on any device.
Start expanding your horizons with Start expanding your horizons with GiOlibGiOlib!!
Related products
-
Sale

Bill Bartmann – Billionaire Business Systems Member Site (2012)
Original price was: $1,000.00.$87.30Current price is: $87.30. -
Sale

Jeff Paul – How To Make A Surgeon’s Income Being A Consultant
Original price was: $297.00.$45.90Current price is: $45.90. -
Sale
Brian Tracy – Total Business Mastery Home Study Program
Original price was: $1,497.00.$44.10Current price is: $44.10. -
Sale

Andrew Dymski – The Agency Sales System
Original price was: $1,997.00.$118.80Current price is: $118.80.